|
Sun in real time
|
|
Solar Cycle Progression and Space Weather
Sunspots are dark areas that become apparent at the Sun’s photosphere as a result of intense magnetic flux pushing up from further within the solar interior. Areas along this magnetic flux in the upper photosphere and chromosphere heat up, and usually become visible as faculae and plage – often times termed active regions. This causes cooler (7000 F), less dense and darker areas at the heart of these magnetic fields than in the surrounding photosphere (10,000 F) - seen as sunspots. Active regions associated with sunspot groups are usually visible as bright enhancements in the corona at EUV and X-ray wavelengths. Rapid changes in the magnetic field alignment of sunspot groups’ associated active regions are the most likely sources of significant space weather events such as solar flares, CMEs, radiations storms, and radio bursts. Sunspots appear in a wide variety of shapes and forms. The darkest area of a sunspot (also the first to be observed) is called the umbrae. As the sunspot matures (becomes more intense), a less dark, outlying area of well-defined fibril-like structure develops around the umbrae - called penumbra. Sunspots can grow from an individual unipolar spot into more organized bipolar spot groups; or even evolve into immense, very complex sunspot groups with mixed magnetic polarities throughout the group. The largest sunspot groups can cover large swaths of the Sun’s surface and be many times the size of Earth. Sunspot groups that are clearly visible and observed by designated ground-based observatories, are assigned a NOAA/SWPC 4-digit region number to officially record and track the sunspot group as it rotates across the visible solar disk. Sunspot groups are analyzed and characterized based on their size and complexity by SWPC forecasters each day using the modified Zurich classification scale and Mount Wilson magnetic classification system. This daily sunspot analysis and classification is submitted at the end of each UTC-day as the Solar Region Summary report. Sunspots can change continuously and may last for only a few hours to days; or even months for the more intense groups. The total number of sunspots has long been known to vary with an approximately 11-year repetition known as the solar cycle. The peak of sunspot activity is known as solar maximum and the lull is known as solar minimum. Solar cycles started being assigned consecutive numbers. This number assignment began with solar cycle 1 in 1755 and the most recent being cycle 24 – which began in December, 2008 and is now nearing solar minimum. A new solar cycle is considered to have begun when sunspot groups emerge at higher latitudes with the magnetic polarities of the leading spots opposite that of the previous cycle. A plot of sunspot number progression for the previous and current solar cycle, and that compares the observed and smoothed values with the official sunspot number forecast provided by the Solar Cycle Prediction Panel representing NOAA, the International Space Environmental Services (ISES), and NASA is available to view on our SWPC webpage at solar cycle progression. The official daily and monthly sunspot numbers are determined by the World Data Center – Sunspot Index and Long-term Solar Observations (WDC-SILSO (link is external)) at the Royal Observatory of Belgium. Generally, sunspot reports from observatories calculate sunspot numbers whereby each sunspot group counts as 10, and every umbra within each spot group is individually considered as 1. Therefore, no sunspots on the visible Sun would be considered as zero; while the next possible number can only be 11 or higher.
The solar radio flux at 10.7 cm (2800 MHz) is an excellent indicator of solar activity. Often called the F10.7 index, it is one of the longest running records of solar activity. The F10.7 radio emissions originates high in the chromosphere and low in the corona of the solar atmosphere. The F10.7 correlates well with the sunspot number as well as a number of UltraViolet (UV) and visible solar irradiance records. The F10.7 has been measured consistently in Canada since 1947, first at Ottawa, Ontario; and then at the Penticton Radio Observatory in British Columbia, Canada. Unlike many solar indices, the F10.7 radio flux can easily be measured reliably on a day-to-day basis from the Earth’s surface, in all types of weather. Reported in “solar flux units”, (s.f.u.), the F10.7 can vary from below 50 s.f.u., to above 300 s.f.u., over the course of a solar cycle. These F10.7 measurements are provided courtesy of the National Research Council Canada in partnership with the Natural Resources Canada. The F10.7 Index has proven very valuable in specifying and forecasting space weather. Because it is a long record, it provides climatology of solar activity over six solar cycles. Because it comes from the chromosphere and corona of the sun, it tracks other important emissions that form in the same regions of the solar atmosphere. The Extreme UltraViolet (EUV) emissions that impact the ionosphere and modify the upper atmosphere track well with the F10.7 index. Many Ultra-Violet emissions that affect the stratosphere and ozone also correlate with the F10.7 index. And because this measurement can be made reliably and accurately from the ground in all weather conditions, it is a very robust data set with few gaps or calibration issues.
The solar wind continuously flows outward from the Sun and consists mainly of protons and electrons in a state known as a plasma. Solar magnetic field is embedded in the plasma and flows outward with the solar wind. Different regions on the Sun produce solar wind of different speeds and densities. Coronal holes produce solar wind of high speed, ranging from 500 to 800 kilometers per second. The north and south poles of the Sun have large, persistent coronal holes, so high latitudes are filled with fast solar wind. In the equatorial plane, where the Earth and the other planets orbit, the most common state of the solar wind is the slow speed wind, with speeds of about 400 kilometers per second. This portion of the solar wind forms the equatorial current sheet. During quiet periods, the current sheet can be nearly flat. As solar activity increases, the solar surface fills with active regions, coronal holes, and other complex structures, which modify the solar wind and current sheet. Because the Sun rotates every 27 days, the solar wind becomes a complex spiral of high and low speeds and high and low densities that looks like the skirt of a twirling ballerina (see figure). When high speed solar overtakes slow speed wind, it creates something known as a corotating interaction region. These interaction regions consist of solar wind with very high densities and strong magnetic fields. Above the current sheet, the higher speed solar wind typically has a dominant magnetic polarity in one direction and below the current sheet, the polarity is in the opposite direction. As the Earth moves through this evolving ballerina skirt, it is sometimes within the heliospheric current sheet, sometimes above it and sometime below it. When the magnetic field of the solar wind switches polarity, it is a strong indication that Earth has crossed the current sheet. The location of the Earth with respect to the current sheet is important because space weather impacts are highly dependent on the solar wind speed, the solar wind density, and the direction of the magnetic field embedded in the solar wind. Each of the elements mentioned above play a role in space weather. High speed winds bring geomagnetic storms while slow speed winds bring calm space weather. Corotating interaction regions and to a lesser extent, current sheet crossings, can also cause geomagnetic disturbances. Thus specifying and forecasting the solar wind is critical to developing forecasts of space weather and its impacts at Earth. 
Solar flares usually take place in active regions, which are areas on the Sun marked by the presence of strong magnetic fields; typically associated with sunspot groups. As these magnetic fields evolve, they can reach a point of instability and release energy in a variety of forms. These include electromagnetic radiation, which are observed as solar flares. Solar flare intensities cover a large range and are classified in terms of peak emission in the 0.1 – 0.8 nm spectral band (soft x-rays) of the NOAA/GOES XRS. The X-ray flux levels start with the “A” level (nominally starting at 10-8 W/m2). The next level, ten times higher, is the “B” level (≥ 10-7 W/m2); followed by “C” flares (10-6 W/m2), “M” flares (10-5 W/m2), and finally “X” flares (10-4 W/m2).
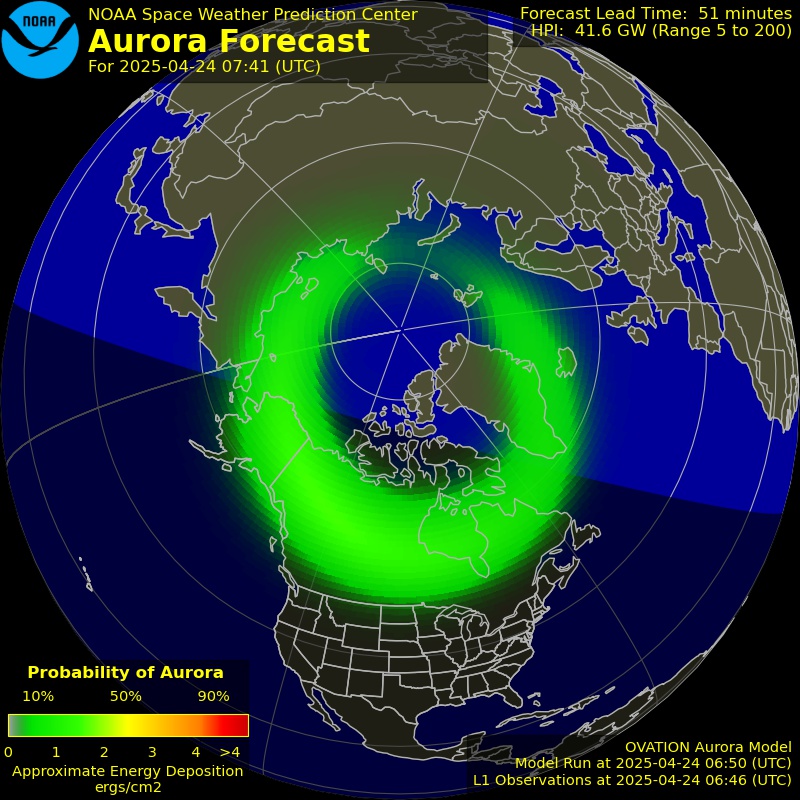
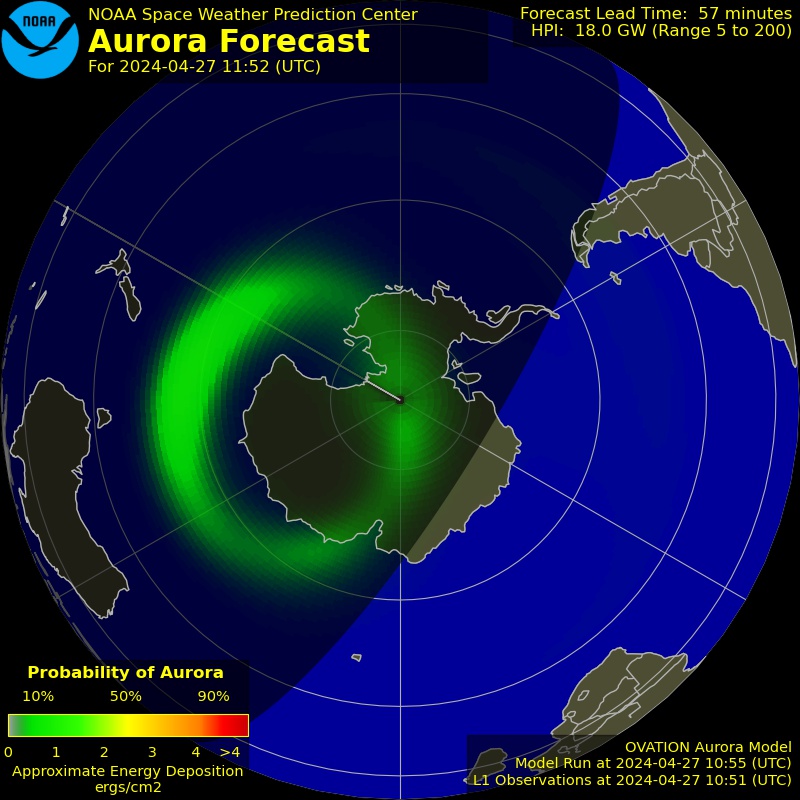
The Aurora Borealis (Northern Lights) and Aurora Australis (Southern Lights) are the result of electrons colliding with the upper reaches of Earth’s atmosphere. (Protons cause faint and diffuse aurora, usually not easily visible to the human eye.) The electrons are energized through acceleration processes in the downwind tail (night side) of the magnetosphere and at lower altitudes along auroral field lines. The accelerated electrons follow the magnetic field of Earth down to the Polar Regions where they collide with oxygen and nitrogen atoms and molecules in Earth’s upper atmosphere. In these collisions, the electrons transfer their energy to the atmosphere thus exciting the atoms and molecules to higher energy states. When they relax back down to lower energy states, they release their energy in the form of light. This is similar to how a neon light works. The aurora typically forms 80 to 500 km above Earth’s surface. Earth’s magnetic field guides the electrons such that the aurora forms two ovals approximately centered at the magnetic poles. During major geomagnetic storms these ovals expand away from the poles such that aurora can be seen over most of the United States. Aurora comes in several different shapes. Often the auroral forms are made of many tall rays that look much like a curtain made of folds of cloth. During the evening, these rays can form arcs that stretch from horizon to horizon. Late in the evening, near midnight, the arcs often begin to twist and sway, just as if a wind were blowing on the curtains of light. At some point, the arcs may expand to fill the whole sky, moving rapidly and becoming very bright. This is the peak of what is called an auroral substorm. Then in the early morning the auroral forms can take on a more cloud-like appearance. These diffuse patches often blink on and off repeatedly for hours, then they disappear as the sun rises in the east. The best place to observe the aurora is under an oval shaped region between the north and south latitudes of about 60 and 75 degrees. At these polar latitudes, the aurora can be observed more than half of the nights of a given year. When space weather activity increases and more frequent and larger storms and substorms occur, the aurora extends equatorward. During large events, the aurora can be observed as far south as the US, Europe, and Asia. During very large events, the aurora can be observed even farther from the poles. Of course, to observe the aurora, the skies must be clear and free of clouds. It must also be dark so during the summer months at auroral latitudes, the midnight sun prevents auroral observations.  
|

|
Magyar Napfizikai Alapítvány Hungarian Solar Physics Fundation |
Last update: 2023 Mar © Copyright HSPF 2017 |


